Canvas Introduction
The <canvas> element is a new HTML5 markup element that allows drawing in a web page without using Document Object Model (DOM) APIs or plug-ins. Although somewhat new, the <canvas> element has been adopted by most modern browsers.
Instead of creating graphics on-screen using HTML elements and other markup with CSS styling, Canvas allows the drawing of graphics directly using JavaScript commands like drawRect, fill, and drawImage. In addition, it is possible to manipulate pixels directly to modify images and create special effects. Although Canvas is currently a 2D drawing API, 3D support is planned for future releases.
Canvas is gaining popularity because of the following features:
- Allows drawing of graphics directly without having to resort to
<div>or CSS tricks - Canvas is a web standard, supported by most browsers, with compatible implementations
- More easily hardware accelerated resulting in fast animations
Note: Although using the <canvas> element is straightforward, it is helpful to have a basic understanding of HTML and JavaScript.
Browser / Platform Support
At this time Canvas is supported in the latest versions of almost all modern browsers and virtually all smartphone platforms support Canvas.
The following table lists the supported platforms and versions:
| Browser | Supported in Version(s) |
|---|---|
| Firefox | 2.0 |
| Internet Explorer | IE 9.0 |
| Chrome | 4.0 |
| Opera | Desktop - 9.0
Mobile - 10.0 |
| Safari | Desktop - 3.1
Mobile - 3.2 |
| Platform | Supported in Version(s) |
|---|---|
| Android | 2.1 |
| BlackBerry | BlackBerry OS 6.0+
BlackBerry PlayBook 1.0+ |
| HP webOS | webOS 1.4.5
webOS 2.0 |
Testing for Support
Although most modern browsers support Canvas, some of the older versions do not. Therefore, it is a good practice to test for Canvas support. There are two mechanisms to test for Canvas support:
Canvas Fallback
To be safe, provide alternative content inside the canvas element as shown in the following example:
<canvas id="clock" width="100" height="100">
   The current time is: 03:51 PM
</canvas>
Browsers which support <canvas> will ignore the fallback content and render the canvas normally. Otherwise, browsers which don't support <canvas> will render the fallback content within the element.
Testing in JavaScript
To check for Canvas support in JavaScript, test for the getContext() method. The following code shows how to do this:
var canvas = document.getElementById('mycanvas');
if (canvas.getContext){
  // canvas supported code here
} else {
  // canvas not supported code here
}
Differences from SVG
While both Canvas and SVG can be used to create graphics, they are very different and each has their own purpose. Canvas is an immediate mode drawing surface whereas SVG is a retained mode scene graph. This means that Canvas is a lower level API than SVG, giving the developer more control and speed at the cost of more code and complexity. SVG is a higher level API, which lets the developer quickly draw shapes, but at the cost of fewer features and reduced speed. In addition, SVG is a resolution-independent vector API, while canvas is a resolution-dependent bitmap API.
Currently, Canvas has better browser support and can be used to draw vectors like SVG.
Getting Started
The Canvas API is very simple to work with - create a canvas element in the HTML page, grab a drawing context, start drawing.
The following example shows the minimum code needed to draw a rectangle:
<html>
<head>
  <style type="text/css">
    canvas { border: 1px solid black; }
  </style>
</head>
<body>

<h3>Canvas Demo</h3>
<canvas id="mycanvas" width="200" height="100"></canvas>

<script language="Javascript">

// Obtain a reference to the canvas element
var canvas = document.getElementById('mycanvas');

// Obtain a context to draw on
var c = canvas.getContext('2d');

// Set the fill color
c.fillStyle = "red";

// Draw a filled rectangle
c.fillRect(10,10,50,50);

</script>

</body>
</html>
This code produces the following result:
The canvas element must have an id (mycanvas in this case) so that a reference to the canvas can be obtained. In addition, the canvas element must specify a width and height.
To get the drawing context, get a reference to the Canvas element (using getElementById) and call getContext('2d').
With the drawing context, drawing is performed with commands like fillRect and draw.
Note: In the future, Canvas will support contexts other than '2d', such as the pending WebGL spec for 3D graphics.
Tag Description
The canvas tag is used to is used to draw graphics using scripting (usually JavaScript) on a web page.
A canvas is a rectangular area and it has several methods for drawing paths, boxes, circles, characters, and adding images.
Note: The <canvas> element has no drawing abilities of its own. All drawing must be done inside JavaScript
This tag has the form:
<canvas id="id" width="width" height="height">
  fallback_content
</canvas>
Note: The optional fallback_content is rendered by browsers that do not support the canvas tag.
HTML5 and HTML4.01 Differences
This tag is new for HTML5.
Attributes
| Attribute | Value | Description |
|---|---|---|
| width | pixels | Specifies the width of the canvas (default = 300)
(cannot be negative) |
| height | pixels | Specifies the height of the canvas area (default = 150)
(cannot be negative) |
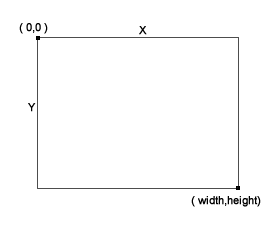
Canvas Coordinates
The canvas' X and Y coordinates are used to position drawings on the canvas. In the diagram below, the upper-left of the rectangle is (0,0) and the bottom-right is (width, height):
Global Attributes
This tag also supports the HTML Global Attributes.
Event Attributes
This tag also supports the HTML Event Attributes.
Examples
The following example shows the basic use of this tag:
<canvas id="myCanvas" width="200" height="150">
</canvas>
The following JavaScript is used to draw a rectangle in the canvas:
<script>
  // Find the canvas element
  var c = document.getElementById("myCanvas");

  // Create a context object
  var cxt = c.getContext("2d");

  // Draw a red rectangle
  cxt.fillStyle = "#FF0000";
  cxt.fillRect(0,0,150,75);
</script>
This produces the following result:
Checking for Support
The following JavaScript can be used check for canvas support when executing:
<script>
  var c = document.getElementById("myCanvas");

  if (c.getContext)
  {
    var cxt = c.getContext("2d");

    // drawing code
  }
  else
  {
    // canvas unsupported code
  }
</script>
Browser Support
| Chrome | Firefox | IE | Safari | Opera |
|---|---|---|---|---|
| 4.0 | 2.0 | 9.0 | 3.1 | 9.0 |
Doctype Declaration Support
The following table lists the doctype declarations this element may appear in:
| HTML4.01 / XHTML1.0 | XHTML 1.1 | HTML 5 | ||
|---|---|---|---|---|
| Traditional | Strict | Frameset | ||
Miscellaneous Information
| Defined In: | HTML5 |
|---|---|
| Empty Tag: | No |
Drawing Shapes
Canvas only directly supports the drawing of rectangles, paths, and images. Other shapes must be drawn using paths (discussed below).
Rectangles
Drawing rectangles is as simple as setting the fillStyle then calling fillRect with the x, y, width, and height of the rectangle. To draw just the outline of a rectangle, set the strokeStyle and lineWidth, then call the strokeRect function.
The following code draws a filled rectangle and two stroked rectangles:
c.fillStyle = "red";
c.fillRect(10,10,50,50);

c.strokeStyle = "blue";
c.lineWidth = 1;
c.strokeRect(70,10,50,50);
c.strokeRect(130.5,10.5,50,50);
This code produces the following result:
Notice in the code above that the third rectangle starts drawing at an x and y of 130.5 and 10.5. When drawing a shape with a stroke, it is essentially tracing the outline of the shape using a pen with a width determined by the lineWidth property. The pen is centered on the edge of the shape, which means a one pixel wide stroke would actually draw half a pixel outside and half a pixel inside, resulting in a blurry line (as seen in the second rectangle). To make the line perfectly smooth, it is best to offset the drawing by an extra 0.5 pixel.
The fillStyle and strokeStyle attributes must be set using the CSS color syntax, which can either be color names or hex values.
Paths
In Canvas, a path is a shape composed of line and/or curve segments. The path may be either open or closed. A path is closed if the first and last points meet, otherwise it is open.
Note: Only closed paths can be filled.
Lines
Paths are defined by calling beginPath(), issuing some drawing commands, then calling closePath(). Once the path is defined, it can be filled or stroked.
The following code defines a triangle using the moveTo() and lineTo() commands, then fills and strokes the triangle:
c.fillStyle = "red";

c.beginPath();
c.moveTo(10,10);
c.lineTo(60,10);
c.lineTo(60,60);
c.lineTo(10,10);
c.closePath();

c.fill();

c.lineWidth = 1;
c.strokeStyle = "blue";
c.stroke();
This code produces the following result:
Curves
Curves are drawn using the bezierCurveTo() command, which will draw a bezier curve connected to the previous point and a new point defined by the last two arguments. The first four arguments are for the control points of the curve.
c.fillStyle = "red";

c.beginPath();
c.moveTo(10,40.5);
c.bezierCurveTo(10,80,60,0,60,40.5);
c.closePath();

c.fill();

c.lineWidth = 1;
c.strokeStyle = "blue";
c.stroke();
This code produces the following result:
Arcs
Arcs and Circles can be drawn using the arc() and arcTo() functions.
c.fillStyle = "green";

c.beginPath();
c.arc(60,60,30,Math.PI,3*Math.PI/2);
c.strokeStyle='rgb(0,200,12)';

c.lineWidth = 10;
c.stroke();
This code produces the following result:
Note: In the example above, there is no matching 'endPath'. In this case it is not necessary since we are not closing the path.
Quadratics
Quadratics can be drawn using the quadraticCurveTo() function.
Browser Support
The following table lists the attributes / methods related to this section and their browser compatibility:
| Firefox | IE | Chrome | Opera | Safari | |
|---|---|---|---|---|---|
| Attributes / Methods | |||||
| fillRect() | |||||
| strokeRect() | |||||
| clearRect() | |||||
| beginPath() | |||||
| closePath() | |||||
| moveTo() | |||||
| lineTo() | |||||
| fill() | |||||
| stroke() | |||||
| bezierCurveTo() | |||||
| arc() | |||||
| arcTo() | |||||
| quadradicCurveTo() |
Drawing Images
Images can be drawn using the drawImage() method. The image must already be loaded for it to be drawn, therefore it is best to put the drawing code in the image's onload() event handler.
The following example shows the basic use of the drawImage() method:
var img = new Image();
img.onload = function() {
    c.drawImage(img,10,10);
}

img.src = 'chrome-32x32.png';
This code produces the following result:
The drawImage() method has several variations that can be used to stretch and slice images.
One variation allows adjusting the drawing size of the image by adding width and height arguments to the function.
The following example stretches the image to twice its regular size:
var img = new Image();
img.onload = function() {
    c.drawImage(img,10,10,64,64);
}

img.src = 'chrome-32x32.png';
This code produces the following result:
Note: Images can become blurry when scaling up or grainy if they're scaled down too much. This is especially true if the image contains text. Be aware of this when using drawimage() with scaling.
Another variation allows selection of a sub-rectangle within the source image, in addition to the location and size of the target image. This allows the drawing of just portions of the image to the Canvas, stretched and placed however specified. Using this form of drawImage() is useful for fast image clipping, often found in scrolling platform video games.
The following example uses the top-left quarter of the image and draws it at regular size, then the bottom-right quarter of the image and draws it at twice its size:
var img = new Image();
img.onload = function() {

  c.drawImage(img,
    0,0,15,15,  //source
    10,10,16,16 //dest
    );

  c.drawImage(img,
    16,16,16,16, //source
    26,26,32,32 //dest
    );
}

img.src = 'chrome-32x32.png';
This code produces the following result:
Browser Support
The following table lists the attributes / methods related to this section and their browser compatibility:
| Firefox | IE | Chrome | Opera | Safari | |
|---|---|---|---|---|---|
| Attributes / Methods | |||||
| drawImage() |
Colors
Stroke and fill colors must be specified using the CSS color syntax. Either color names, RGB hex values, or the rgb and rgba color functions can be used. Additionally, the rgb and hslfunctions using percentage values have been defined in the HTML5 specification, but most browsers do not support them yet.
The following code shows six different ways to specify a color:
c.fillStyle = "black";
c.fillStyle = "orange";
c.fillRect(10,10,30,30);

c.fillStyle = "black";
c.fillStyle = "rgb(255,165,0)";
c.fillRect(45,10,30,30);

c.fillStyle = "black";
c.fillStyle = "rgba(255,165,0,1.0)";
c.fillRect(80,10,30,30);

c.fillStyle = "black";
c.fillStyle = "#ffa500";
c.fillRect(115,10,30,30);

c.fillStyle = "black";
c.fillStyle = "hsl(100%,25%,0)";
c.fillRect(150,10,30,30);

c.fillStyle = "black";
c.fillStyle = "rgb(0,100%,0)";
c.fillRect(185,10,30,30);
This code produces the following result:
Note: If any of the rectangles above appear black, it means the form is not supported by the browser.
Transparency
Global Alpha
The amount of transparency, or alpha, for colors can be defined using the rgba color function, but this function will affect only the current fill or stroke color. The alpha can also be set to affect all drawing using the globalAlpha property.
The following code draws the color orange four times. The first row contains a square with the color orange with full opacity (1.0), and a second square with the color orange with half opacity (0.5). The second row draws the same squares again, but this time with globalAlpha set to 0.5. Notice how the last square combines transparency on both the color and globalAlpha to produce an even lighter color.
// Set no transparency
c.globalAlpha = 1.0;

c.fillStyle = "rgba(255,165,0,1.0)";
c.fillRect(35,0,30,30);
c.fillStyle = "rgba(255,165,0,0.5)";
c.fillRect(70,0,30,30);

// Set partial transparency
c.globalAlpha = 0.5;

c.fillStyle = "rgba(255,165,0,1.0)";
c.fillRect(35,0,30,30);
c.fillStyle = "rgba(255,165,0,0.5)";
c.fillRect(70,0,30,30);
This code produces the following result:
Browser Support
The following table lists the attributes / methods related to this section and their browser compatibility:
| Firefox | IE | Chrome | Opera | Safari | |
|---|---|---|---|---|---|
| Attributes / Methods | |||||
| Color Names | |||||
| Hex Values | |||||
| rgb() | |||||
| rgba() | |||||
| hsl | |||||
| rgb% |
| Firefox | IE | Chrome | Opera | Safari | |
|---|---|---|---|---|---|
| Attributes / Methods | |||||
| globalAlpha |
Line Styles
Using Canvas, lines are drawn using three properties: lineWidth, lineCap, and lineJoin.
Line Width
The lineWidth property controls the width of the line.
The following example shows the same line drawn with different widths:
for(i = 1; i < 10; i++) {
  c.fillStyle = "black";
  c.lineWidth = i;
  c.beginPath();
  c.moveTo(i * 10,10);
  c.lineTo(i * 10,90);
  c.stroke();
}
This code produces the following result:
Line Cap
The lineCap property controls the way the end of the line is drawn. There are three different types of caps: butt (the default), round, and square. butt draws the line end with a flat end, round draws the line end with a rounded end, and square draws the line end with a squared end that extends past the final point.
The following example shows the different line caps:
var ends = ['butt','round','square'];

for(i=0;i<3;i++) {
    c.fillStyle = "black";
    c.lineWidth = 10;
    c.lineCap = ends[i];
    c.beginPath();
    c.moveTo(20,20+20*i);
    c.lineTo(50,20+20*i+20);
    c.lineTo(80,20+20*i);
    c.stroke();
}
This code produces the following result:
Line Join
The lineJoin property controls the way line segments are joined together. There are three different types of line joins: round, bevel, and miter (the default). round draws a join with a round curve, bevel draws a join with a chopped off bevel, and miter draws a join with a straight angle.
The maximum length of the miter can be further controlled with the miterLimit property.
The following example shows the different line joins:
var joins = ['round','bevel','miter'];

for(i=0;i<3;i++) {
    c.fillStyle = "black";
    c.lineWidth = 10;
    c.lineJoin = joins[i];
    c.beginPath();
    c.moveTo(20,15+20*i);
    c.lineTo(50,15+20*i+30);
    c.lineTo(80,15+20*i);
    c.stroke();
}
This code produces the following result:
Browser Support
The following table lists the attributes / methods related to this section and their browser compatibility:
| Firefox | IE | Chrome | Opera | Safari | |
|---|---|---|---|---|---|
| Attributes / Methods | |||||
| lineWidth | |||||
| lineCap | |||||
| lineJoin | |||||
| miterLimit |
Gradients
Canvas can both fill and stroke shapes using linear or radial gradients.
Linear gradients
A linear gradient fills an area by blending the colors provided as stops. It can have any number of stops, but must have at least two. It is called a linear gradient because it blends the colors in a straight line.
To use a linear gradient:
- create a gradient with the
createLinearGradientfunction - add at least two color stops at various positions between 0 and 1
- set the gradient as the fill style
The createLinearGradient method takes the x and y coordinates of the start and ending points of a gradient.
The following example shows a horizontal linear gradient:
// Horizontal gradient
var grad = c.createLinearGradient(0,0,200,0);
grad.addColorStop(0, "white");
grad.addColorStop(1, "black");
c.fillStyle = grad;
c.fillRect(0,0,200,100);
This code produces the following result:
Strokes can also be drawn using a gradient. The following example strokes a rectangle with a gradient:
var grad = c.createLinearGradient(0,0,100,100);
grad.addColorStop(0, "white");
grad.addColorStop(1, "black");
c.lineWidth = 10;
c.strokeStyle = grad;
c.strokeRect(10,10,80,80);
This code produces the following result:
Radial Gradients
Radial gradients use the same color stop syntax as linear gradients, but have a different creation function. The createRadialGradient method takes six arguments: x1, y1, r1 x2, y2, r2. The first three arguments define the start circle at x1, y1 with a radius r1. The second three arguments define the ending circle at x2, y2 and radius r2. In general the first circle should be inside the second circle.
var grad = c.createRadialGradient(45,45,10,52,50,30);
grad.addColorStop(0, "white");
grad.addColorStop(1, "black");

c.fillStyle = grad;
c.fillRect(10,10,80,80);
This code produces the following result:
Browser Support
The following table lists the attributes / methods related to this section and their browser compatibility:
| Firefox | IE | Chrome | Opera | Safari | |
|---|---|---|---|---|---|
| Attributes / Methods | |||||
| createLinearGradient() | |||||
| createRadialGradient() |
Patterns
Fills and strokes can also use repeating image patterns. As with drawImage, the image should be loaded before drawing.
Create an image pattern with the createPattern function, passing it the image and a repeat keyword. The repeat keyword can be either repeat, repeat-y, repeat-x, or no-repeat; which are the same as in CSS.
The following example fills a rectangular area with a pattern and repeats the pattern in both the x and y directions:
var img = new Image();

img.onload = function() {
    var canvas = document.getElementById('can');
    var c = canvas.getContext('2d');
    var pat = c.createPattern(img,'repeat');
    c.fillStyle = pat;
    c.fillRect(10,10,280,80);
}

img.src = 'chrome-32x32.png';
This code produces the following result:
Browser Support
The following table lists the attributes / methods related to this section and their browser compatibility:
| Firefox | IE | Chrome | Opera | Safari | |
|---|---|---|---|---|---|
| Attributes / Methods | |||||
| createPattern() |
Description
The Canvas transform() method specifies a transformation matrix to apply to future drawings. This has the effect of applying the specified matrix to the canvas.
This method has the form:
context.transform(scale-x,skew-x,skew-y,scale-y,translate-x,translate-y)| Parameter | Description |
|---|---|
| scale-x | (required) Specifies how far to move drawing on the canvas horizontally. Positive values move the drawing origin to the right, negative values move the drawing origin to the left. |
| skew-x | (required) Specifies how far to move drawing on the canvas vertically. Positive values move the drawing origin down, negative values move the drawing origin up. |
| skew-y | (required) Specifies how far to move drawing on the canvas vertically. Positive values move the drawing origin down, negative values move the drawing origin up. |
| skew-y | (required) Specifies how far to move drawing on the canvas vertically. Positive values move the drawing origin down, negative values move the drawing origin up. |
| translate-x | (required) Specifies how far to move drawing on the canvas horizontally. Positive values move the drawing origin to the right, negative values move the drawing origin to the left. |
| translate-x | (required) Specifies how far to move drawing on the canvas vertically. Positive values move the drawing origin down, negative values move the drawing origin up. |
Examples
The following example shows the basic use of this method.
var c = document.getElementById("myCanvas");
var ctx = c.getContext("2d");

ctx.fillStyle = "red";
ctx.fillRect(10,10,20,20);

ctx.transform(50,50);
ctx.fillRect(10,10,20,20);
This produces the following result:
Browser Support
| Chrome | Firefox | IE | Safari | Opera |
|---|---|---|---|---|
Graphics State
The current transformations are part of the graphics state, which is the list of properties that defines the current way objects are drawn. This state includes not only the current transformations but also the current fillColor, strokeColor, lineWidth, and anything else that affects drawing.
The graphics state can be saved using context.save() and restored using context.restore().
The following example draws a red rectangle, saves the state, draws a green rectangle with translation, restores the state, then draws another red rectangle:
c.strokeStyle = "red";
c.lineWidth = 2;
c.strokeRect(0,0,30,30);

// Save the current state
c.save();

c.strokeStyle = "green";
c.lineWidth = 6;

// Translate
c.translate(60,20);
c.strokeRect(0,0,30,30);

// Restore the previous state
c.restore();

c.strokeRect(0,30,30,30);
This code produces the following result:
Note: The graphics state is stored in a stack structure, i.e. saving the state pushes it onto the stack, restoring pops the top state off the stack.
Browser Support
The following table lists the attributes / methods related to this section and their browser compatibility:
| Firefox | IE | Chrome | Opera | Safari | |
|---|---|---|---|---|---|
| Attributes / Methods | |||||
| save() | |||||
| restore() |
Compositing
Compositing is the process of placing objects on the canvas. By default, items are drawn using "source-over", meaning that new shapes are drawn over the existing canvas content. There are different settings for compositing and the drawing behavior can be changed by setting the globalCompositeOperation property.
The following examples shows an example of the "source-over", "lighter", and "destination-out" settings:
// Draw labels
c.fillStyle = "#000";
c.font="10px Arial";
c.fillText("source-over",10,90);
c.fillText("lighter",110,90);
c.fillText("destination-out",210,90);


// Draw 1st rectangle
c.fillStyle = "#09f";
c.fillRect(10,10,50,50);

// Set composite property
c.globalCompositeOperation = "source-over";

// Draw 1st circle
c.fillStyle = "#f30";
c.beginPath();
c.arc(55,55,25,0,Math.PI*2,true);
c.fill();


// Draw 2nd rectangle
c.fillStyle = "#09f";
c.fillRect(110,10,50,50);

// Set composite property
c.globalCompositeOperation = "lighter";

// Draw 2nd circle
c.fillStyle = "#f30";
c.beginPath();
c.arc(155,55,25,0,Math.PI*2,true);
c.fill();


// Draw 3rd rectangle
c.fillStyle = "#09f";
c.fillRect(210,10,50,50);

// Set composite property
c.globalCompositeOperation = "destination-out";

// Draw 3rd circle
c.fillStyle = "#f30";
c.beginPath();
c.arc(255,55,25,0,Math.PI*2,true);
c.fill();
This code produces the following result:
Compositing Attributes Table
The following table lists the compositing attributes with an example of each:
|
|
|
|
|
|
|
|
|
|
|
|
|
|
|
Browser Support
The following table lists the attributes / methods related to this section and their browser compatibility:
| Firefox | IE | Chrome | Opera | Safari | |
|---|---|---|---|---|---|
| Attributes / Methods | |||||
| globalCompositeOperation |
| Firefox | IE | Chrome | Opera | Safari | |
|---|---|---|---|---|---|
| Attributes / Methods | |||||
| source-over | |||||
| source-in | |||||
| source-out | |||||
| source-atop | |||||
| destination-over | |||||
| destination-in | |||||
| destination-out | |||||
| destination-atop | |||||
| lighter | |||||
| darken | |||||
| xor | |||||
| copy |
Clipping
Normally when drawing shapes to the canvas, the shape is completely drawn. Sometimes, the desire is to draw just a portion of the shape. This is known as clipping. When a shape is clipped, any subsequent drawing will be clipped by the clip shape. Only pixels inside the clip shape will actually be drawn on screen.
A clip shape is defined by a path, the same as when drawing a path. However, instead of then calling the draw() method, call the clip() method. After the clip shape is defined, any further drawing will be clipped by the clip shape.
Note: To remove a clip, save the state before setting a clip shape, then restore the graphics state afterwards.
The following example defines a circular clip shape then draws a red rectangle:
// Save the state
c.save();

// Draw a circle
c.beginPath();
c.arc(50,50,40,0, Math.PI*2,true);
c.clip();

// Draw a red rectangle clipped by the circle
c.fillStyle = "red";
c.fillRect(10,10,50,50);

// Restore the state
c.restore();
This code produces the following result:
Browser Support
The following table lists the attributes / methods related to this section and their browser compatibility:
| Firefox | IE | Chrome | Opera | Safari | |
|---|---|---|---|---|---|
| Attributes / Methods | |||||
| clip() |
Pixel Manipulation
The Canvas element basically creates an area of pixels. No matter what shape or image is drawn on the canvas, it gets converted to pixels. These pixels can be manipulated directly using the getImageData() and putImageData() methods.
'get' and 'set' ImageData
The getImageData() method returns an ImageData structure containing the width and height of the canvas data as well as the actual pixels stored in a long array of RGBA values called data. Once the pixel data has been obtained, the pixels can be read, changed, and put back to the canvas with the putImageData() method.
The following example draws a red rectangle, 'gets' all of the pixels, sets the green part of each pixel to half (128), sets the blue part of each pixel to 0, then 'puts' the data back to the canvas.
// Draw a rectangle
c.fillStyle = "red";
c.fillRect(10,10,50,50);

// Get the Canvas data
var data = c.getImageData(0, 0, canvas.width, canvas.height);

// Modify the colors
for(n=0; n<data.width*data.height; n++) {
  var pi = n*4; //pixel index
  //data.data[pi]   don't touch the red
  data.data[pi+1] = 128;  // set green to half
  data.data[pi+2] = 0;  //set blue to zero
  data.data[pi+3] = 255; //set alpha to max
}

// Put the Canvas data
c.putImageData(data,0,0);
This code produces the following result:
Note: Each pixel is represented by four values -- the red, blue, green, and alpha values. Because they are separate values, they can be manipulated without having to use bit-shifting.
Creating ImageData
Instead of getting the image data using getImageData(), a new imageData can be created from scratch with the createImageData method.
The following example creates a new 50x50 pixel imageData object, fills it with random red/blue/green pixels, then puts the data onto the Canvas:
// Create the ImageData
var data = c.createImageData(50,50);

// Set each pixel to a random color
for(n=0; n<data.width*data.height;n++) {
  var index = n*4;
  //fill with random red/blue color
  data.data[index] = Math.random()*255;
  data.data[index+1] = Math.random()*255;
  data.data[index+2] = Math.random()*255;
  data.data[index+3] = 255;
}

// Set the data back
c.putImageData(data,10,10);
This code produces the following result:
Browser Support
The following table lists the attributes / methods related to this section and their browser compatibility:
| Firefox | IE | Chrome | Opera | Safari | |
|---|---|---|---|---|---|
| Attributes / Methods | |||||
| createImageData() | |||||
| getImageData() | |||||
| putImageData() |
Transformations
Using Canvas, arbitrary geometric transforms can be applied to any graphics drawn.
The following example shows how the same square can be drawn with translate(), rotate(), and scale():
c.strokeStyle = "red";
c.lineWidth = 1;
c.strokeRect(0,0,30,30);

c.strokeStyle = "green";
c.translate(60,20);
c.strokeRect(0,0,30,30);

c.strokeStyle = "blue";
c.rotate(Math.PI/4);
c.strokeRect(0,0,30,30);

c.strokeStyle = "purple";
c.scale(2,1.5);
c.strokeRect(0,0,30,30);
This code produces the following result:
Browser Support
The following table lists the attributes / methods related to this section and their browser compatibility:
| Firefox | IE | Chrome | Opera | Safari | |
|---|---|---|---|---|---|
| Attributes / Methods | |||||
| scale() | |||||
| rotate() | |||||
| translate() | |||||
| transform() | |||||
| setTransform() |
Description
The Canvas translate() method specifies the x and y translate values for future drawings. This has the effect of moving the canvas by the specified values.
This method has the form:
context.translate(x,y)| Parameter | Description |
|---|---|
| x | (required) Specifies how far to move drawing on the canvas horizontally. Positive values move the drawing origin to the right, negative values move the drawing origin to the left. |
| y | (required) Specifies how far to move drawing on the canvas vertically. Positive values move the drawing origin down, negative values move the drawing origin up. |
Examples
The following example shows the basic use of this method.
var c = document.getElementById("myCanvas");
var ctx = c.getContext("2d");

ctx.fillStyle = "red";
ctx.fillRect(10,10,20,20);

ctx.translate(50,50);
ctx.fillRect(10,10,20,20);
This produces the following result:
Browser Support
| Chrome | Firefox | IE | Safari | Opera |
|---|---|---|---|---|
Description
The Canvas rotate() method specifies the rotation value for future drawings. This has the effect of rotating the canvas by the specified value.
Note: The rotation is done in an angle from the canvas' position of 0,0.
This method has the form:
context.rotate(angle)| Parameter | Description |
|---|---|
| angle | (required) Specifies the angle, in radians, of rotation to apply to the canvas
To convert degrees to radians, use: degrees * PI/180 |
Examples
The following example shows the basic use of this method.
var c = document.getElementById("myCanvas");
var ctx = c.getContext("2d");

ctx.fillStyle = "red";
ctx.rotate(20 * (Math.PI/180));
ctx.fillRect(0,0,40,40);
This produces the following result:
Browser Support
| Chrome | Firefox | IE | Safari | Opera |
|---|---|---|---|---|
Description
The Canvas scale() method specifies the x and y scale values for future drawings.
This method has the form:
context.scale(x,y)| Parameter | Description |
|---|---|
| x | (required) Specifies the scaling of the the width, e.g. a value of 1.0 = no scaling, 0.5 = half the width, 2.0 = twice the width |
| y | (required) Specifies the scaling of the the height, e.g. a value of 1.0 = no scaling, 0.5 = half the height, 2.0 = twice the height |
Examples
The following example shows the basic use of this method.
var c = document.getElementById("myCanvas");
var ctx = c.getContext("2d");

ctx.fillStyle = "red";
ctx.fillRect(10,10,20,20);

ctx.scale(3,3);
ctx.fillRect(10,10,20,20);
This produces the following result:
Browser Support
| Chrome | Firefox | IE | Safari | Opera |
|---|---|---|---|---|